¶ 8.3. Добавление виджетов
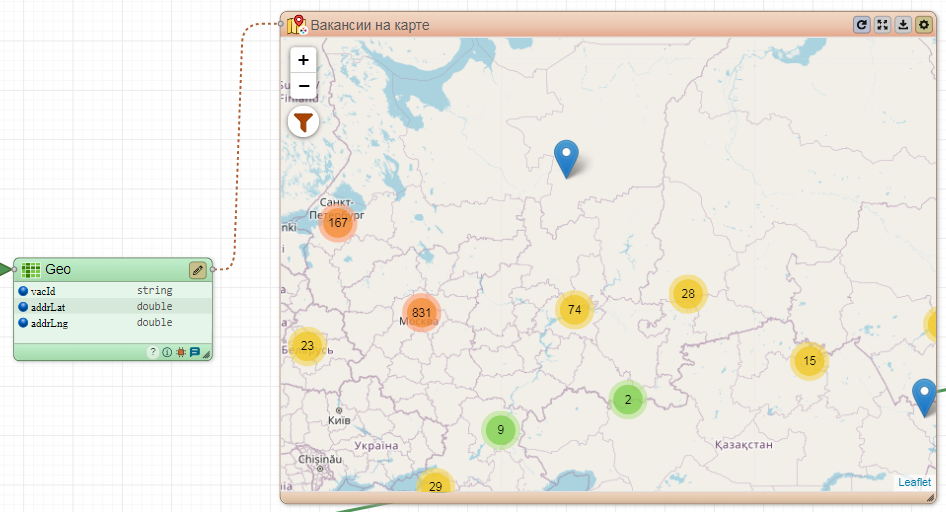
¶ 8.3.1. Добавление виджета Карта
Для добавления виджета Карта Вакансии на карте:
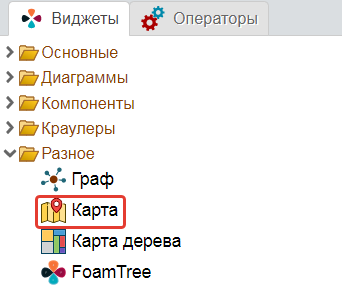
- перейдите на вкладку Виджеты в блоке под областью ведения проекта;
- в папке Разное выберите виджет Карта (см. рис. 8.3.1.1) и перенесите его в рабочую область на срез Geo.
Перейдите в настройки виджета нажатием на кнопку Шестеренка в левом верхнем углу виджета:
- переименуйте виджет в “Вакансии на карте”;
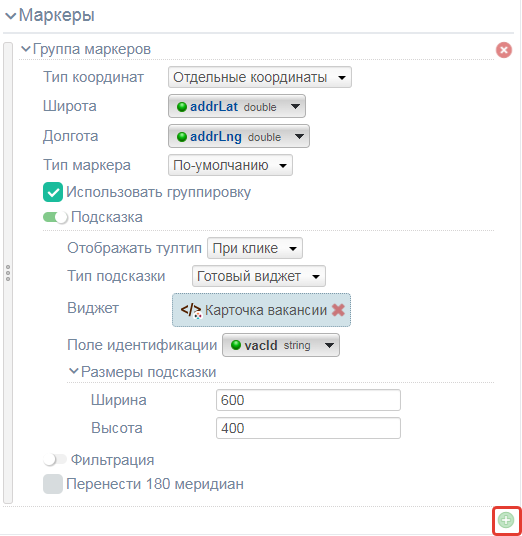
- в блоке Маркеры настройте параметры согласно рис. 8.3.1.2;
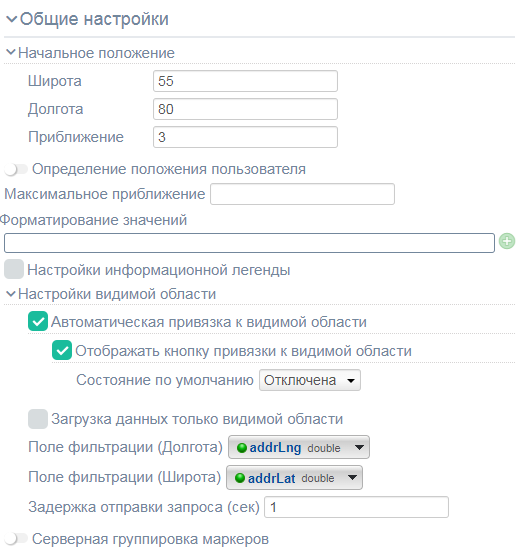
- в блоке Общие настройки настройте параметры согласно рис. 8.3.1.3;
- нажмите на кнопку Сохранить в левом верхнем углу.
В результате будет сформирован виджет Карта Вакансии на карте (рис. 8.3.1.3).
¶ 8.3.2. Добавление виджета Круговая диаграмма
¶ 8.3.2.1. Добавление виджета Круговая диаграмма Распределение вакансий
Для добавления виджета Круговая диаграмма Распределение вакансий:
- перейдите на вкладку Виджеты в блоке под областью ведения проекта;
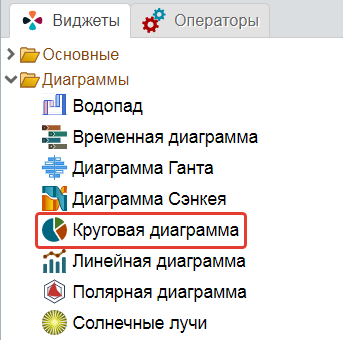
- в папке Диаграммы выберите виджет Круговая диаграмма (см. рис. 8.3.2.1.1) и перенесите его в рабочую область на срез biAll;
Перейдите в настройки виджета:
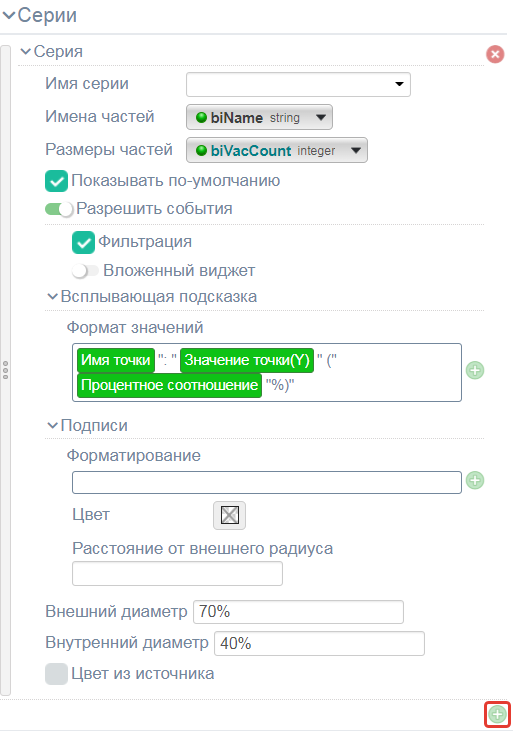
- переименуйте виджет в “Распределение вакансий”;
- в блоке Серии настройте параметры согласно рис. 8.3.2.1.2;
- нажмите на кнопку Сохранить.
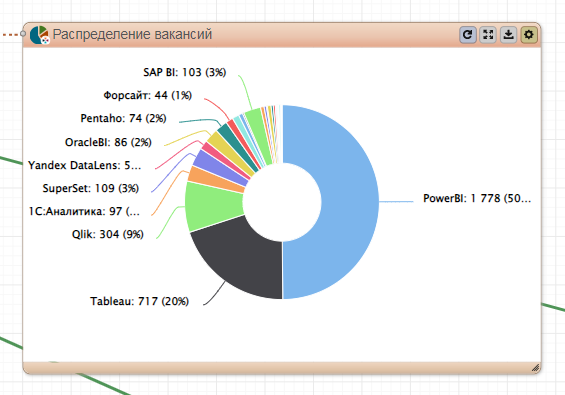
В результате будет сформирован виджет Круговая диаграмма Распределение вакансий (см. рис. 8.3.2.1.3).
¶ 8.3.2.2. Добавление виджета Круговая диаграмма Занятость
Для добавления виджета Круговая диаграмма Занятость:
- перейдите на вкладку Виджеты в блоке под областью ведения проекта;
- в папке Диаграммы выберите виджет Круговая диаграмма и перенесите его в рабочую область на срез schedules.
Перейдите в настройки виджета:
- переименуйте виджет в “Занятость”;
- в блоке Серии настройте параметры согласно рис. 8.3.2.2.1;
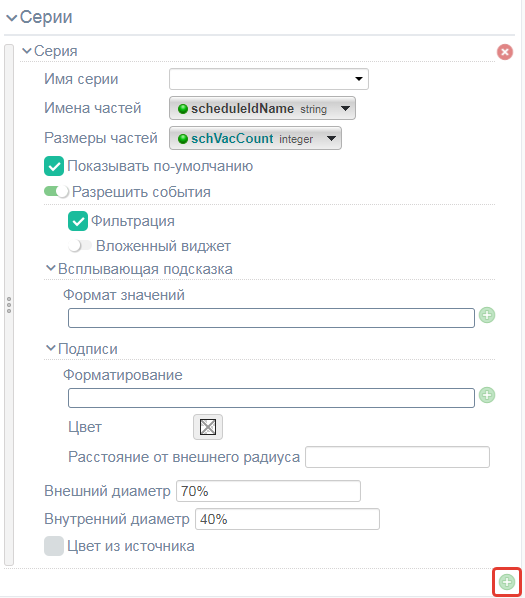
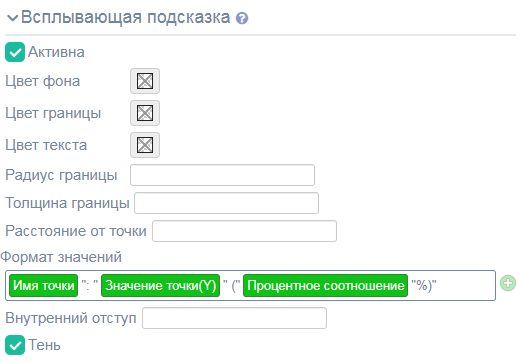
- в блоке Всплывающая подсказка настройте параметры согласно рис. 8.3.2.2.2;
- нажмите на кнопку Сохранить.
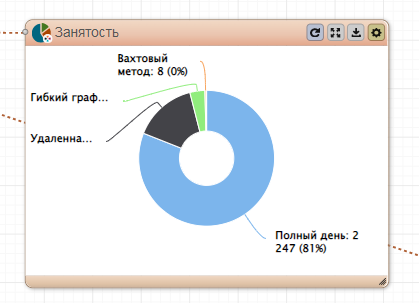
В результате будет сформирован виджет Круговая диаграмма Занятость (рис. 8.3.2.2.3).
¶ 8.3.3. Добавление виджета Временная диаграмма
Для добавления виджета Временная диаграмма Вакансии по дням:
- перейдите на вкладку Виджеты в блоке под областью ведения проекта;
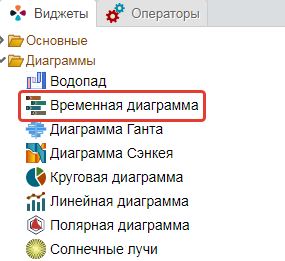
- в папке Диаграммы выберите виджет Временная диаграмма (см. рис. 8.3.3.1) и перенесите его в рабочую область на срез vacs.
Перейдите в настройки виджета:
- переименуйте виджет в “Вакансии по дням”;
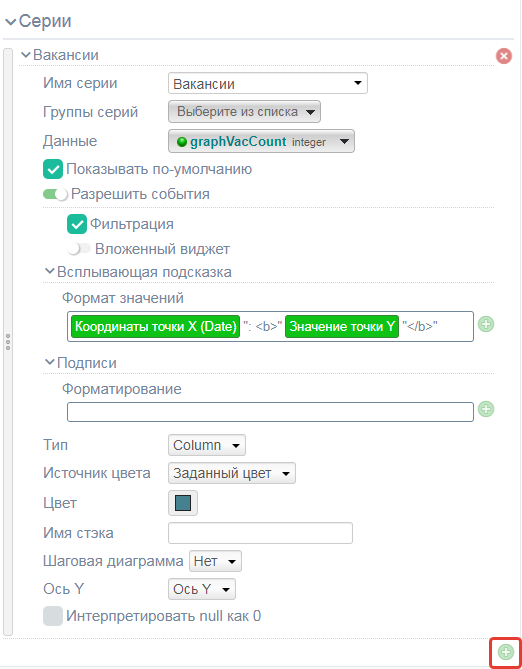
- в блоке Серии настройте параметры согласно рис. 8.3.3.2;
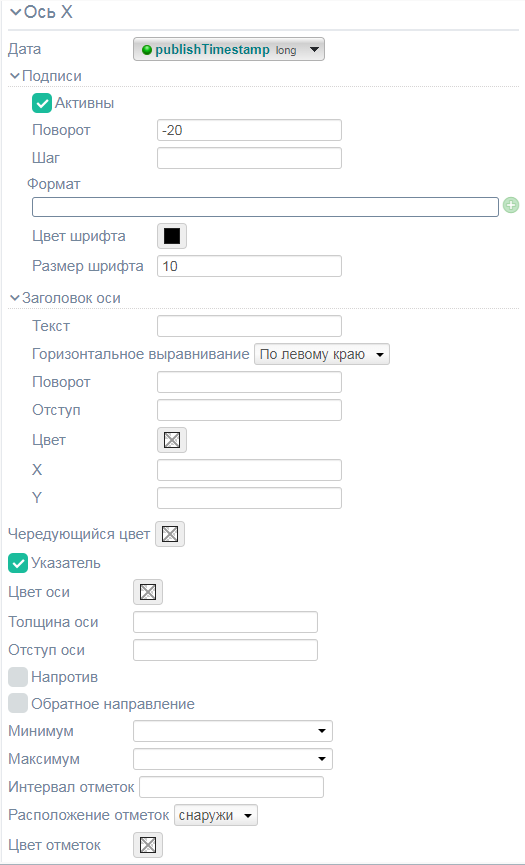
- в блоке Ось Х настройте параметры согласно рис. 8.3.3.3;
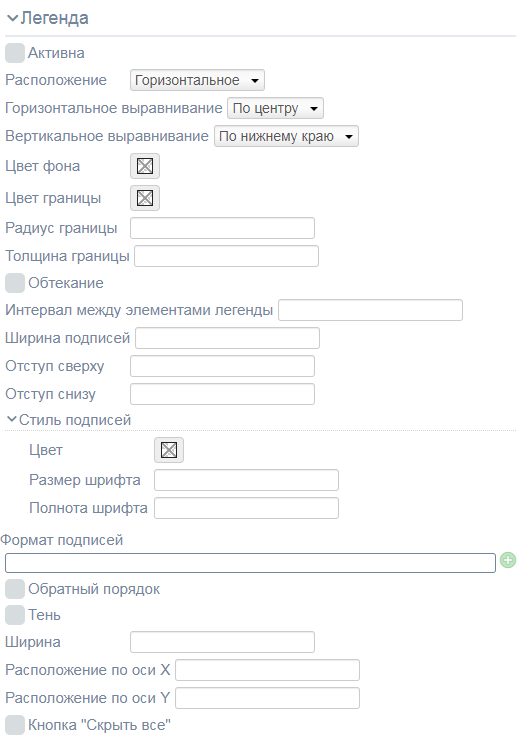
- в блоке Легенда настройте параметры согласно рис. 8.3.3.4;
- нажмите на кнопку Сохранить.
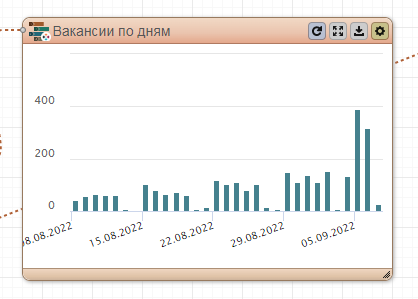
В результате будет сформирован виджет Временная диаграмма Вакансии по дням (рис. 8.3.3.5).
¶ 8.3.4. Добавление виджета Таблица
¶ 8.3.4.1. Добавление виджета Таблица Вакансии
Для добавления виджета Таблица Вакансии:
- перейдите на вкладку Виджеты в блоке под областью ведения проекта;
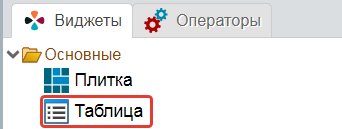
- в папке Основные выберите виджет Таблица (см. рис. 8.3.4.1.1) и перенесите его в рабочую область на срез vacs.
Перейдите в настройки виджета:
- переименуйте виджет в “Вакансии”;
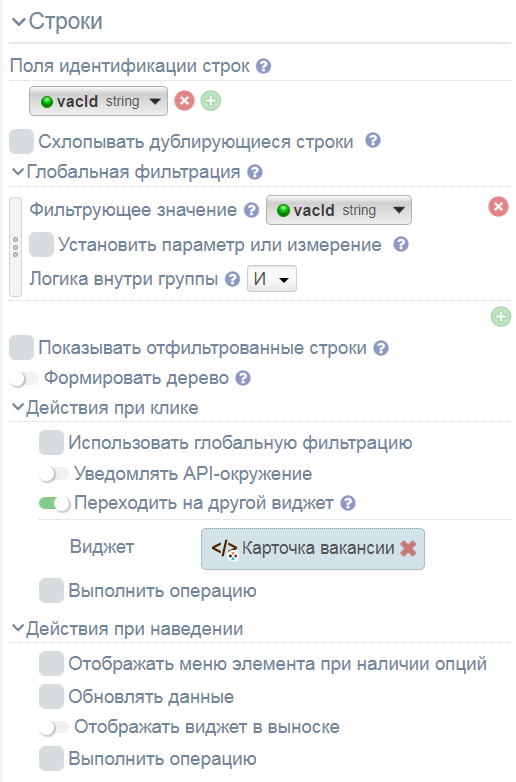
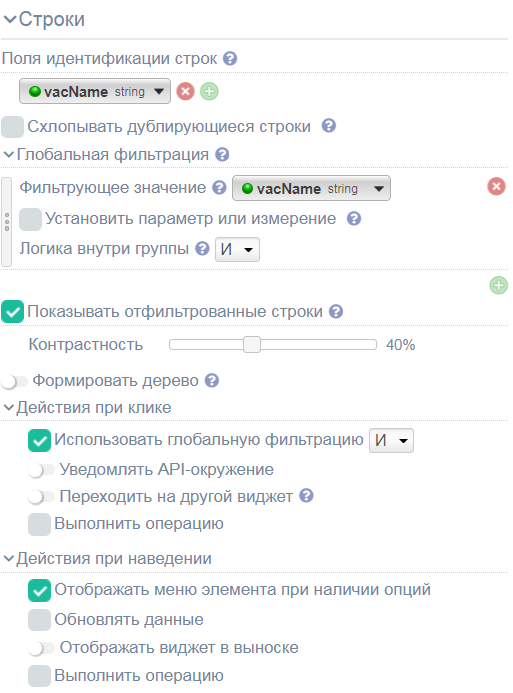
- в блоке Строки настройте параметры согласно рис. 8.3.4.1.2;
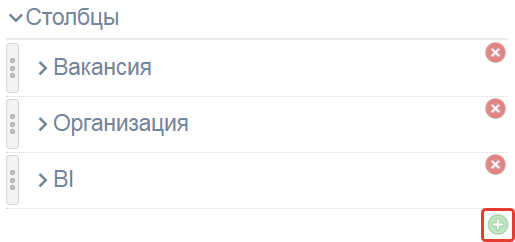
- в блоке Столбцы добавьте 3 столбца нажатием на кнопку + (рис. 8.3.4.1.3);
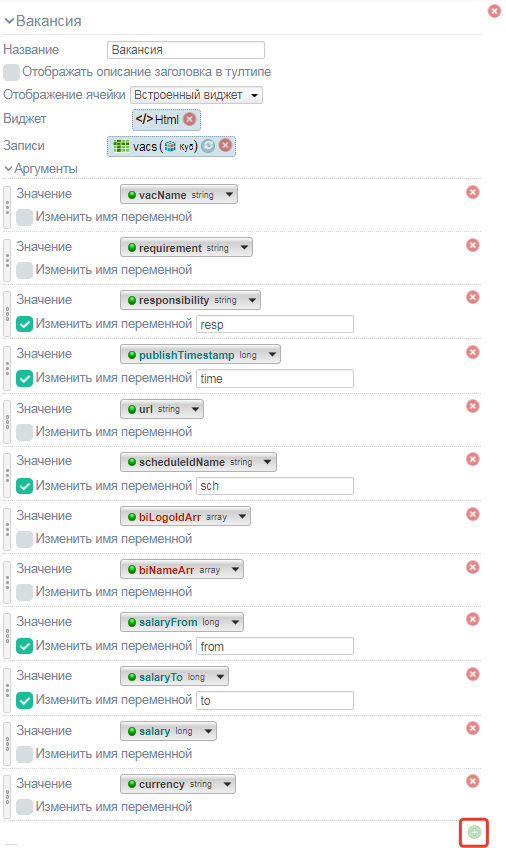
- переименуйте первый столбец в “Вакансии” и настройте параметры согласно рис. 8.3.4.1.4;
- в поле HTML вставьте код:
{{
function toDateStr(){
var dt = new Date(it.time);
var nowDt = new Date();
 var dateStr = ('0' + dt.getDate()).slice(-2) + '.' +
 ('0' + (dt.getMonth()+1)).slice(-2) + '.' +
 dt.getFullYear();
if(dt.getFullYear() == nowDt.getFullYear() &&
 dt.getMonth() == nowDt.getMonth() ) {
 if( dt.getDate() == nowDt.getDate() ) {
  dateStr = 'сегодня';
 }
 if( dt.getDate() == nowDt.getDate() - 1 ) {
  dateStr = 'вчера';
 }
}
var timeStr = ('0' + dt.getHours()).slice(-2) + ':' + ('0' + dt.getMinutes()).slice(-2);
return dateStr + ' в ' + timeStr;
}
function formatNum(x) {
   return x.toString().replace(/\B(?=(\d{3})+(?!\d))/g, " ");
}
function suffix(){
switch(it.currency){
case 'USD':
 return '$';
case 'EUR':
 return '€';
case 'BYR':
 return 'Br';
case 'UZS':
 return 'сӯм';
case 'KZT':
 return '₸';
case 'RUR':
default:
 return '₽';
}
}
}}
<style>
.vacContainer {
 font-family:roboto_cnregular;
 position: relative;
 padding: 0 4px;
}
 .vacContainer > .vacTitle {
 font-size: 18px;
 text-decoration:none;
 color: #000;
}
.vacContainer > .date {
 float:right;
 color:#666;
}
.vacContainer > .desc {
 font-size: 13px;
 color:#555;
}
.vacContainer > .tags {}
.vacContainer > .tags > .tag {
 display:inline-block;
 margin-right:4px;
 background-color:#4d94ad;
 padding: 0 4px;
 border-radius: 4px;
 color: #fff;
}
</style>
<div class="vacContainer">
<span class="date">{{=toDateStr()}}</span>
<div class="vacTitle" href="{{=it.url}}" target="_blank">{{=it.vacName}}</div>
{{?it.from && it.to}}
<div>
 <span>от </span>
 <span style="font-size:15px">{{=formatNum(it.from)}}</span>
 <span> {{=suffix()}}</span>
 <span>до </span>
 <span style="font-size:15px">{{=formatNum(it.to)}}</span>
 <span> {{=suffix()}}</span>
</div>
{{??it.salary}}
<div><span style="font-size:18px">{{=formatNum(it.salary)}}</span><span> {{=suffix()}}</span></div>
{{?}}
 {{?it.resp}}
<p class="desc">{{=it.resp}}</p>
{{?}}
</div>переименуйте второй столбец в “Организация” и настройте параметры согласно рис. 8.3.4.1.5;
- в поле HTML вставьте код:
<div href="{{=it.eUrl}}" target="_blank" style="font-family:oswald; font-size:18px; color: #553;">{{=it.name}}</div>
{{?it.addr}}
<p style="font-size:12px">{{=it.addr}}</p>
{{?}}- переименуйте третий столбец в “Bl” и настройте параметры согласно рис. 8.3.4.1.6;
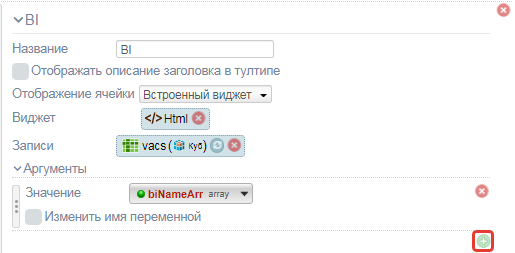
- в поле HTML вставьте код:
<style>
.tags > .tag {
 display:inline-block;
 margin:2px;
 background-color:#4d94ad;
 padding: 0 4px;
 border-radius: 4px;
 color: #fff;
}
</style>
<div class="tags">
{{~it.biNameArr:n:i}}
<div class="tag">{{=n}}</div>
{{~}}
</div>- нажмите на кнопку Сохранить.
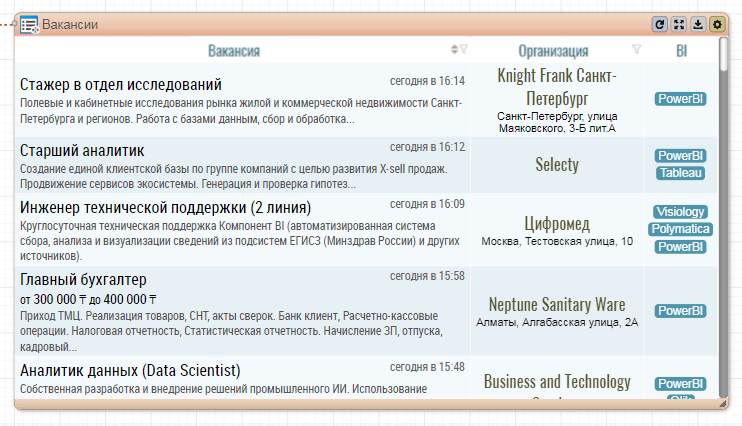
В результате будет сформирован виджет Таблица Вакансии (рис. 8.3.4.1.7).
¶ 8.3.4.2. Добавление виджета Таблица Позиции
Для добавления виджета Таблица Позиции:
- перейдите на вкладку Виджеты в блоке под областью ведения проекта;
- в папке Основные выберите виджет Таблица и перенесите его в рабочую область на срез vacNames.
В настройках виджета:
- переименуйте виджет в “Позиции”;
- в блоке Строки настройте параметры согласно рис. 8.3.4.2.1;
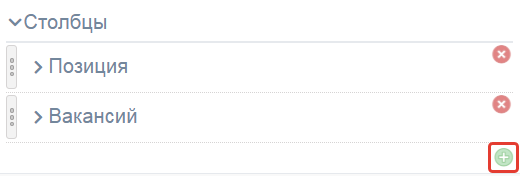
- в блоке Столбцы добавьте 2 столбца нажатием на кнопку + (рис. 8.3.4.2.2);
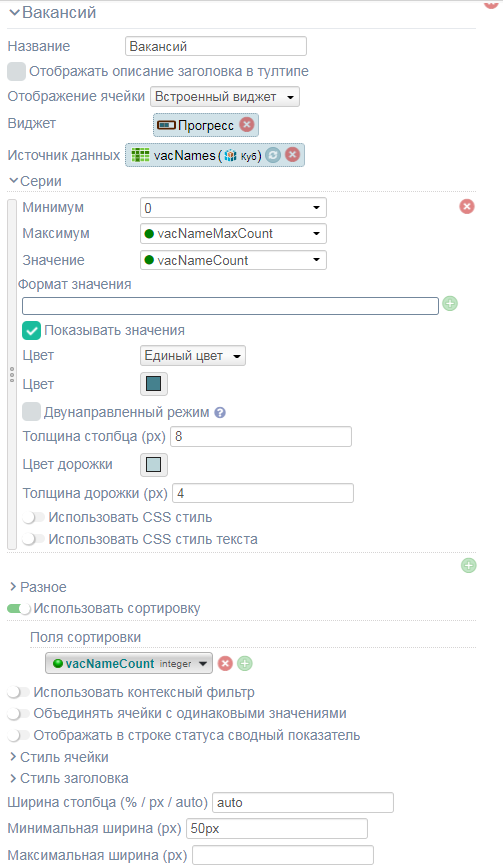
- переименуйте первый столбец в “Вакансии” и настройте параметры согласно рис. 8.3.4.2.3;
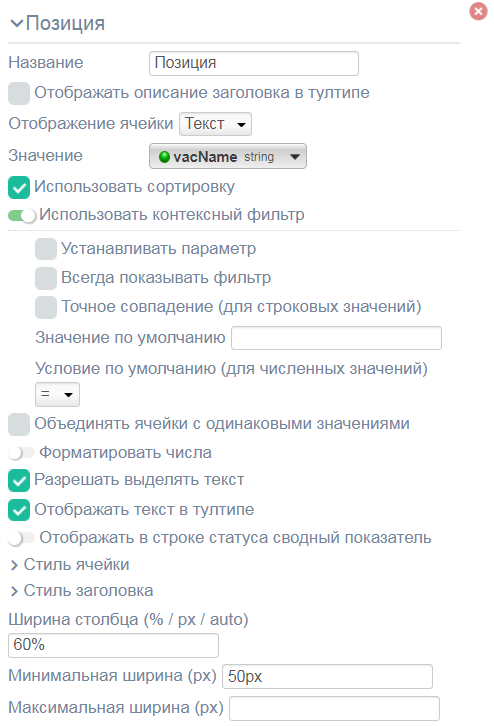
- переименуйте второй столбец в “Позиция” и настройте параметры согласно рис. 8.3.4.2.4;
- нажмите на кнопку Сохранить.
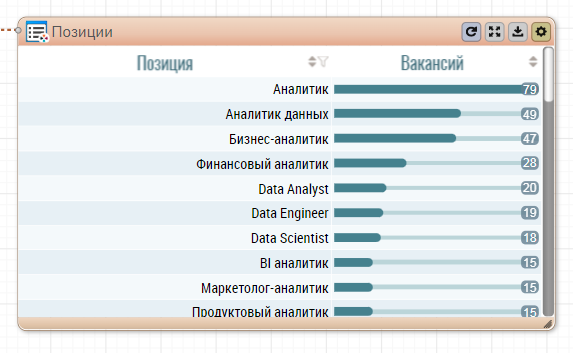
В результате будет сформирован виджет Таблица Позиции (рис. 8.3.4.2.5).
¶ 8.3.4.3. Добавление виджета Таблица Организации
Для добавления виджета Таблица Организации:
- перейдите на вкладку Виджеты в блоке под областью ведения проекта;
- в папке Основные выберите виджет Таблица и перенесите его в рабочую область на срез employersWithSalary.
В настройках виджета:
- переименуйте виджет в “Организации”;
- в блоке Строки настройте параметры согласно рис. 8.3.4.3.1;
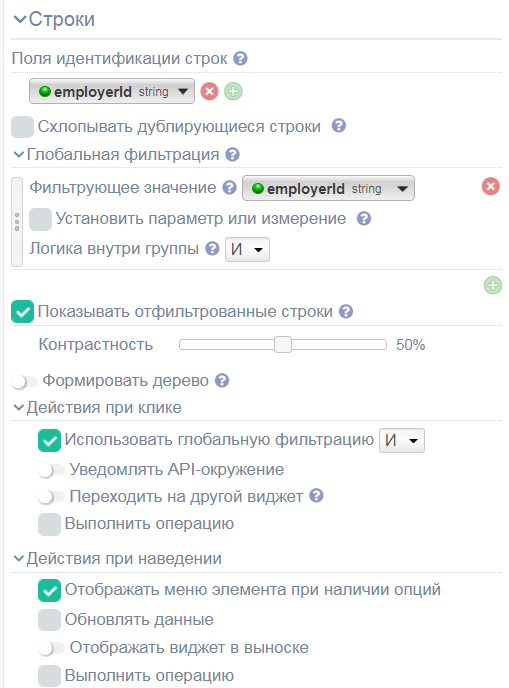
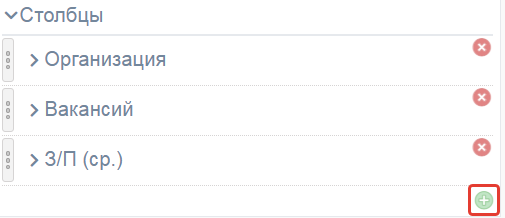
- в блоке Столбцы добавьте 3 столбца нажатием на кнопку + (рис. 8.3.4.3.2);
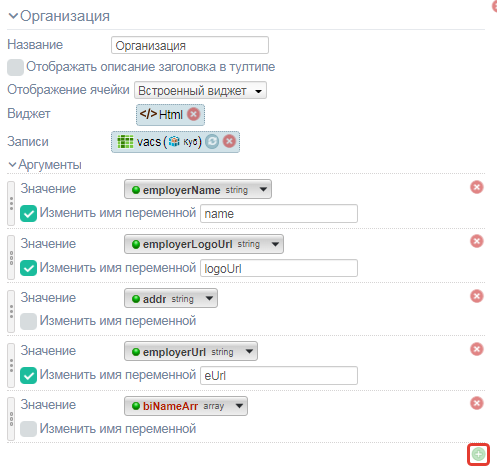
- переименуйте первый столбец в “Организация” и настройте параметры согласно рис. 8.3.4.3.3;
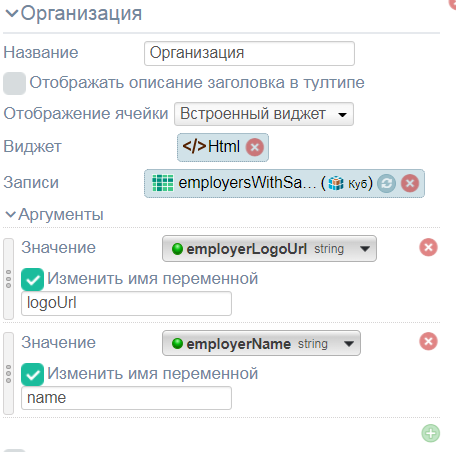
- в поле HTML вставьте код:
<div style="display:flex; flex-direction:row; align-items:center; justify-content:flex-start; padding:2px;">
<img src="{{=it.logoUrl}}" style="width:48px;">
<div style="text-align:left;margin-left:10px;font-family:'roboto_cnregular';font-size:16px">{{=it.name}}</div>
</div>- переименуйте второй столбец в “Вакансий” и настройте параметры согласно рис. 8.3.4.3.4;
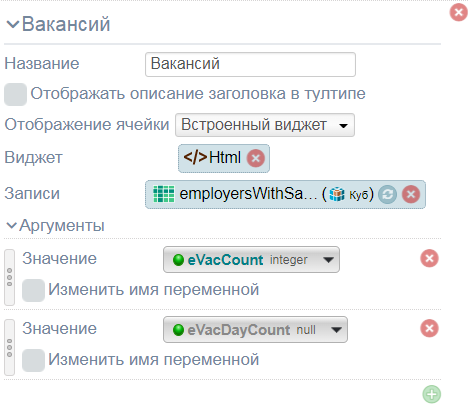
- в поле HTML вставьте код:
<div style="font-family:roboto_cnregular; font-size:20px">
<span>{{=it.eVacCount}}</span>
{{?it.eVacDayCount}}
<span style="font-size:14px; color:#333" title="новых вакансий за сутки">(+{{=it.eVacDayCount}})</span>
{{?}}
</div>- переименуйте третий столбец в “З/П (ср.)” и настройте параметры согласно рис. 8.3.4.3.5;
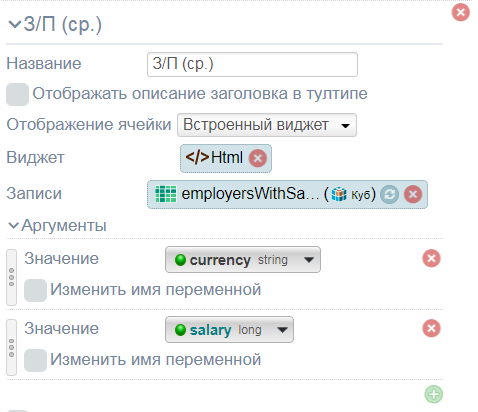
- в поле HTML вставьте код:
{{
function formatNum(x) {
   return x.toString().replace(/\B(?=(\d{3})+(?!\d))/g, " ");
}
function suffix(){
switch(it.currency){
case 'USD':
 return '$';
case 'EUR':
 return '€';
case 'BYR':
 return 'Br';
case 'UZS':
 return 'сӯм';
case 'KZT':
 return '₸';
case 'RUR':
default:
 return '₽';
}
}
}}
{{?it.salary && it.currency}}
<div style="font-family: 'roboto_cnregular';font-size:16px;">
<span>{{=formatNum(it.salary)}}</span><span style="margin-left:4px; font-size:14px; color:#555">{{=suffix()}}</span>
</div>
{{?}}- нажмите на кнопку Сохранить.
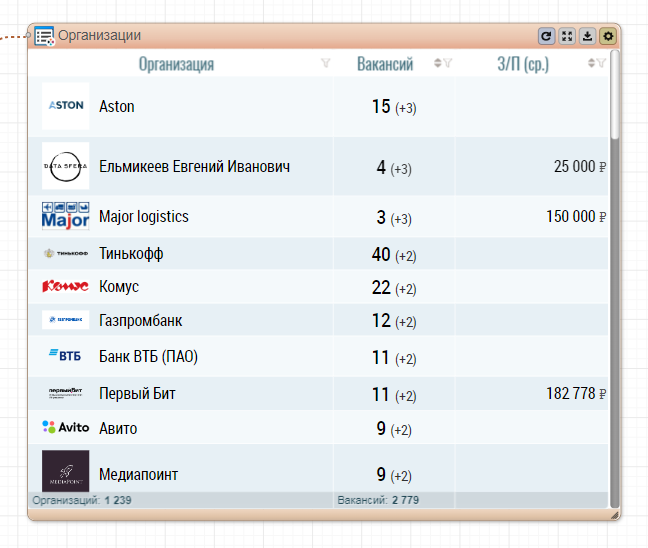
В результате будет сформирован виджет Таблица Организации (рис. 8.3.4.3.6).
¶ 8.3.5. Добавление виджета Html
¶ 8.3.5.1. Добавление виджета Html Карточка вакансии
Для добавления виджета Html Карточка вакансии:
- перейдите на вкладку Виджеты в блоке под областью ведения проекта;
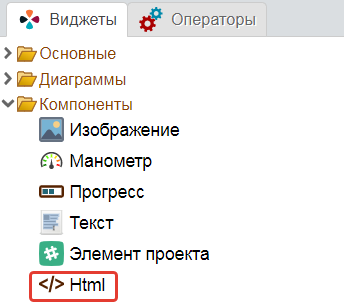
- в папке Компоненты выберите виджет Html (см. рис. 8.3.5.1.1) и перенесите его в рабочую область на срез vacs.
В настройках виджета:
- переименуйте виджет в “Карточка вакансий”;
- в блоке Аргументы настройте значения аргументов при необходимости (добавляются автоматически);
- в поле HTML вставьте код:
{{
function formatNum(x) {
   return x.toString().replace(/\B(?=(\d{3})+(?!\d))/g, " ");
}
function suffix(){
switch(it.currency){
case 'USD':
 return '$';
case 'EUR':
 return '€';
case 'BYR':
 return 'Br';
case 'UZS':
 return 'сӯм';
case 'KZT':
 return '₸';
case 'RUR':
default:
 return '₽';
}
}
function toDateStr(){
var dt = new Date(it.time);
var nowDt = new Date();
 var dateStr = ('0' + dt.getDate()).slice(-2) + '.' +
 ('0' + (dt.getMonth()+1)).slice(-2) + '.' +
 dt.getFullYear();
if(dt.getFullYear() == nowDt.getFullYear() &&
 dt.getMonth() == nowDt.getMonth() ) {
 if( dt.getDate() == nowDt.getDate() ) {
  dateStr = 'сегодня';
 }
 if( dt.getDate() == nowDt.getDate() - 1 ) {
  dateStr = 'вчера';
 }
}
var timeStr = ('0' + dt.getHours()).slice(-2) + ':' + ('0' + dt.getMinutes()).slice(-2);
return dateStr + ' в ' + timeStr;
}
}}
<style>
.card {
 display:flex;
 flex-direction:row;
 justify-content:space-between;
 width: 100%;
 height: 100%;
 font-family: roboto_cnregular;
 padding: 10px;
 font-size:15px;
}
 .card .key {
 margin-top:6px;
 color:#666;
}
 .card > .vacInfo {
 padding:2px 10px;
}
 .card > .vacInfo > .date {
 color:#666;
}
 .card > .vacInfo > .title {
 font-size:20px;
 color:#1b5970;
 text-decoration:none;
}
 .card > .vacInfo > .desc {}
 .card > .vacInfo > .salFromTo {}
 .card > .vacInfo > .salFromTo > .sal {
 font-size:18px;
}
 .card > .vacInfo > .sal > .sal {
 font-size:20px;
}
 .card > .vacInfo > .tags {}
.card > .vacInfo > .tags > .tag {
 display:inline-block;
 margin:2px;
 background-color:#4d94ad;
 padding: 0 4px;
 border-radius: 4px;
 color: #fff;
}
.card > .eInfo {
 display:flex;
 flex-direction:column;
 justify-content:start;
 align-items:center;
 min-width:200px;
 padding:2px 10px;
}
.card > .eInfo > .logo {
 width: 128px;
 box-shadow:0 0 5px #555;
 margin-bottom:4px;
 background-color:#fff;
}
.card > .eInfo > .eTitle {
 font-size:20px;
 font-family:oswald;
 text-align:center;
}
 .card > .eInfo > .eAddr {
 text-align:center;
}
 </style>
<div class="card">
<div class="vacInfo">
 <div class="date">{{=toDateStr()}}</div>
 <a href="{{=it.url}}" target="_blank" class="title">{{=it.vacName}}</a>
 {{?it.salFrom && it.salTo}}
 <div class="salFromTo">
  <span class="sal">{{=formatNum(it.salFrom)}}</span> — <span class="sal">{{=formatNum(it.salTo)}}</span><span class="suf"> {{=suffix()}}</span>
 </div>
 {{??it.sal}}
 <div class="sal">
  <span class="sal">{{=formatNum(it.sal)}}</span><span class="suf"> {{=suffix()}}</span>
 </div>
 {{?}}
 {{?it.desc}}
 <div class="key">Обязанности</div>
 <p class="desc">{{=it.desc}}</p>
 {{?}}
 {{?it.resp}}
 <div class="key">Требования</div>
 <p class="resp">{{=it.resp}}</p>
 {{?}}
 {{?it.sch}}
 <div class="key">Режим</div>
 <p class="resp">{{=it.sch}}</p>
 {{?}}
 <div class="key">Платформы</div>
 <div class="tags">
  {{~it.biNameArr:n:i}}
  <div class="tag">{{=n}}</div>
  {{~}}
 </div>
</div>
<div class="eInfo">
 <img class="logo" src="{{=it.eLogoUrl}}">
 <div class="eTitle">{{=it.eName}}</div>
 {{?it.addr}}
 <div class=eAddr">{{=it.addr}}</div>
 {{?}}
</div>
</div>- нажмите на кнопку Сохранить.
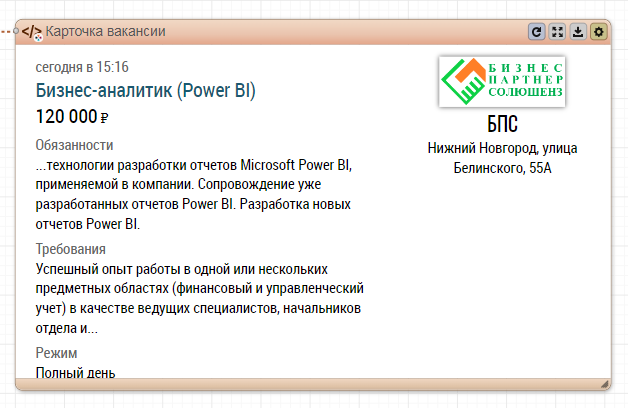
В результате будет сформирован виджет Html Карточка вакансии (рис. 8.3.5.1.2).
¶ 8.3.5.2. Добавление виджета Html Ключевые показатели
Для добавления виджета Html Ключевые показатели:
- перейдите на вкладку Виджеты в блоке под областью ведения проекта;
- в папке Компоненты выберите виджет Html и перенесите его в рабочую область на срез metrics.
В настройках виджета:
- переименуйте виджет в “Ключевые показатели”;
- в блоке Аргументы настройте значения аргументов при необходимости (добавляются автоматически);
- в поле HTML вставьте код:
{{
function formatNumber(x) {
   return x.toString().replace(/\B(?=(\d{3})+(?!\d))/g, " ");
}
}}
<style>
.metricsContainer {
 position: relative;
 display: flex;
 flex-direction: row;
 justify-content: space-around;
 align-items:center;
 width: 100%;
 height: 100%;
 font-family:'roboto_cnregular';
}
.metricsContainer > .block {
 display: flex;
 flex-direction: column;
 justify-content: space-between;
 align-items:center;
 }
.metricsContainer > .block > .header {
 font-size:16px;
 color:#555;
}
.metricsContainer > .block > .value {
 font-size:28px;
}
 .metricsContainer > .block > .items {
 color:#555;
 font-size:13px;
}
 .metricsContainer > .block > .items > .item {}
.metricsContainer > .block > .items > .item > .key {}
.metricsContainer > .block > .items > .item > .val {}
</style>
<div class="metricsContainer">
<div class="block">
 <div class="header" style="color:#896d00d0">Вакансии</div>
 <div class="value" style="color:#896d00">{{=formatNumber(it.vacCount)}}</div>
 <div class="items">
  <div class="item"><span class="key">За час:</span><span class="val"> +{{=formatNumber(it.vacHour)}}</span></div>
  <div class="item"><span class="key">За сутки:</span><span class="val"> +{{=formatNumber(it.vacDay)}}</span></div>
  <div class="item"><span class="key">За неделю:</span><span class="val"> +{{=formatNumber(it.vacWeek)}}</span></div>
 </div>
</div>
<div class="block">
 <div class="header" style="color:#6e0089d0">Организации</div>
 <div class="value" style="color:#6e0089">{{=formatNumber(it.employerCount)}}</div>
</div>
<div class="block">
 <div class="header" style="color:#008389d0">Позиции</div>
 <div class="value" style="color:#008389">{{=formatNumber(it.vacNameCount)}}</div>
</div>
<div class="block">
 <div class="header" style="color:#29760ad0">Платформы</div>
 <div class="value" style="color:#29760a">{{=formatNumber(it.biCount)}}</div>
</div>
<div class="block">
 <div class="header" style="color:#a92406d0">Зарплата (ср.)</div>
 <div class="value" style="color:#a92406">{{?it.salary}}{{=formatNumber(it.salary)}}<span style="color:#a92406d0; font-size:20px"> ₽</span>{{??}}не определена{{?}}</div>
 {{?it.salary}}
 <div class="items">
  <div class="item"><span class="key">Макс:</span><span class="val"> {{=formatNumber(it.maxSalary)}} ₽</span></div>
  <div class="item"><span class="key">Мин:</span><span class="val"> {{=formatNumber(it.minSalary)}} ₽</span></div>
 </div>
 {{?}}
</div>
</div>- нажмите на кнопку Сохранить.
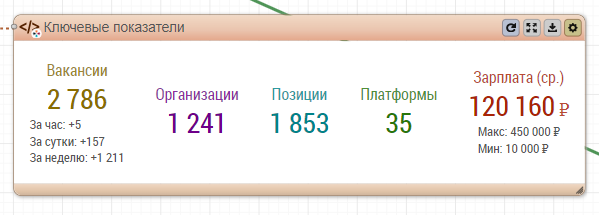
В результате будет сформирован виджет Html Ключевые показатели (рис. 8.3.5.2.1).
¶ 8.3.6. Добавление виджета Плитка
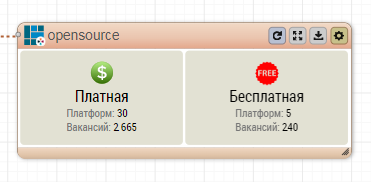
¶ 8.3.6.1. Добавление виджета Плитка opensource
Для добавления виджета Плитка opensource:
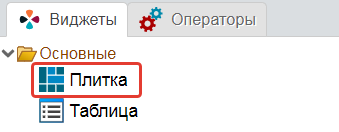
- перейдите на вкладку Виджеты в блоке под областью ведения проекта;
- в папке Основные выберите виджет Плитка (см. рис. 8.3.6.1.1) и перенесите его в рабочую область на срез opensource.
В настройках виджета:
- переименуйте виджет в “opensource”;
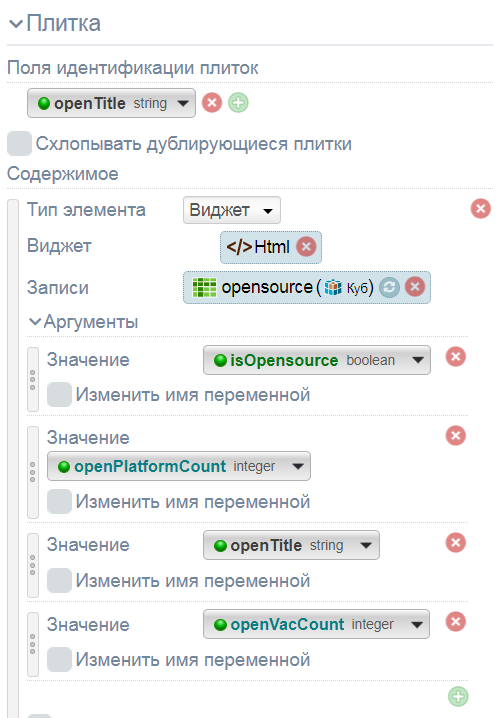
- в блоке Плитка настройте параметры согласно рис. 8.3.6.1.2;
- в поле HTML вставьте код:
{{
function formatNumber(x) {
   return x.toString().replace(/\B(?=(\d{3})+(?!\d))/g, " ");
}
function icon(){
if(it.isOpensource){
 return '/workspace/DownloadEntry.jsb?wsid=fbabde14a8b403a6fe0f58e730a6fb2e&eid=f32811536090dc511b8d15fa0ac827fa';
}
return '/workspace/DownloadEntry.jsb?wsid=fbabde14a8b403a6fe0f58e730a6fb2e&eid=8d75949ac3c7aed938ee8a0eef609aab';
}
}}
<style>
.biContainer {
 position: relative;
 display:flex;
 flex-direction: column;
 justify-content: space-around;
 align-items: center;
 width: 100%;
 height: 100%;
 font-family: 'roboto_cnregular';
}
 .biContainer > .name {
 font-size:16px;
 padding: 0;
 text-align: center;
 }
 .biContainer > img {
 height: 24px;
}
 .biContainer > .items {}
 .biContainer > .items > .opt {
 font-size: 11px;
}
 .biContainer > .items > .opt > .key {
 color: #777;
}
 .biContainer > .items > .opt > .val {}
</style>
<div class="biContainer">
<img src="{{=icon()}}">
<div class="name"><span>{{=it.openTitle}}</span></div>
<div class="items">
 <div class="opt">
  <span class="key">Платформ: </span>
  <span class="val">{{=formatNumber(it.openPlatformCount)}}</span>
 </div>
 <div class="opt">
  <span class="key">Вакансий: </span>
  <span class="val">{{=formatNumber(it.openVacCount)}}</span>
 </div>
</div>
</div>- в поле Внешний вид вставьте:
/* Заполните объект CSS значениями */
{
background-color: #e2e1d3;
border-radius: 4px;
}- в поле Размеры настройте параметры согласно рис. 8.3.6.1.3;

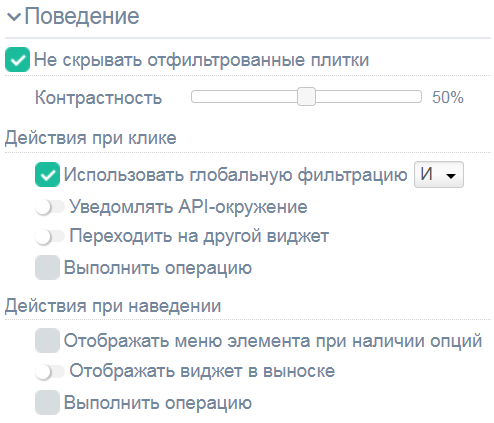
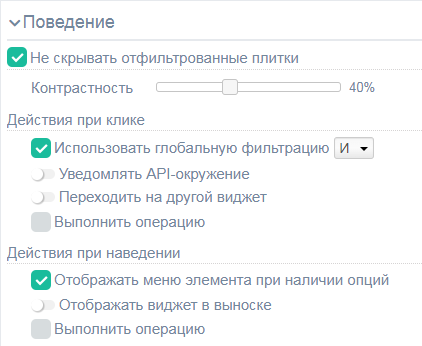
- в блоке Поведение настройте параметры согласно рис. 8.3.6.1.4;
- нажмите на кнопку Сохранить.
В результате будет сформирован виджет Плитка opensource (рис. 8.3.6.1.5).
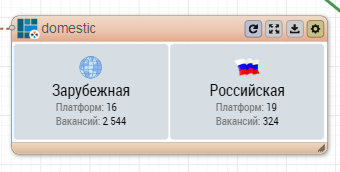
¶ 8.3.6.2. Добавление виджета Плитка domestic
Для добавления виджета Плитка domestic:
- перейдите на вкладку Виджеты в блоке под областью ведения проекта;
- в папке Основные выберите виджет Плитка и перенесите его в рабочую область на срез nativity.
В настройках виджета:
- переименуйте виджет в “domestic”;
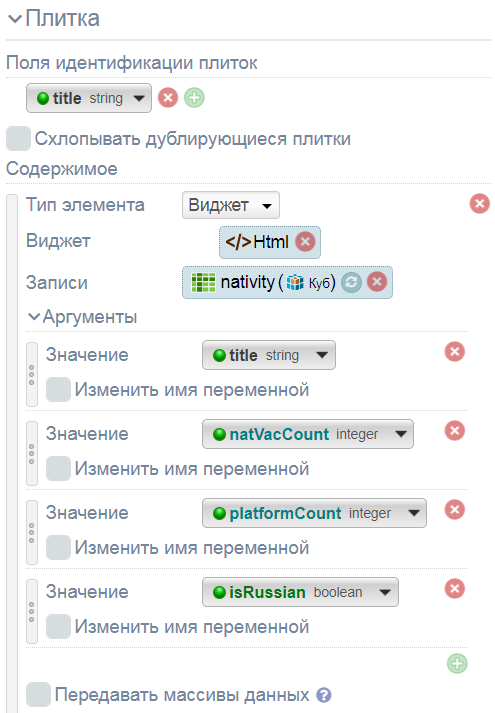
- в блоке Плитка настройте параметры согласно рис. 8.3.6.2.1;
- в поле HTML вставьте код:
{{
function formatNumber(x) {
   return x.toString().replace(/\B(?=(\d{3})+(?!\d))/g, " ");
}
function icon(){
if(it.isRussian){
 return '/workspace/DownloadEntry.jsb?wsid=fbabde14a8b403a6fe0f58e730a6fb2e&eid=79933a01a084695a012ed2dedbe20131';
}
return '/workspace/DownloadEntry.jsb?wsid=fbabde14a8b403a6fe0f58e730a6fb2e&eid=edf69c769008fdf2707c00bdbda3b5db';
}
}}
<style>
.biContainer {
 position: relative;
 display:flex;
 flex-direction: column;
 justify-content: space-around;
 align-items: center;
 width: 100%;
 height: 100%;
 font-family: 'roboto_cnregular';
}
 .biContainer > .name {
 font-size:16px;
 padding: 0;
 text-align: center;
 }
.biContainer > img {
 height: 24px;
}
 .biContainer > .items {}
 .biContainer > .items > .opt {
 font-size: 11px;
}
 .biContainer > .items > .opt > .key {
 color: #777;
}
 .biContainer > .items > .opt > .val {}
</style>
<div class="biContainer">
<img src="{{=icon()}}">
<div class="name"><span>{{=it.title}}</span></div>
<div class="items">
 <div class="opt">
  <span class="key">Платформ: </span>
  <span class="val">{{=formatNumber(it.platformCount)}}</span>
 </div>
 <div class="opt">
  <span class="key">Вакансий: </span>
  <span class="val">{{=formatNumber(it.natVacCount)}}</span>
 </div>
</div>
</div>- в поле Внешний вид вставьте:
/* Заполните объект CSS значениями */
{
background-color: #d3dce2f0;
border-radius: 4px;
}- в полеРазмеры настройте параметры согласно рис. 8.3.6.2.2;
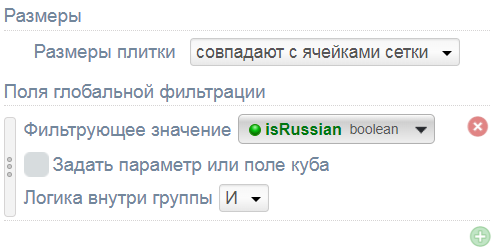
- в блоке Поведение настройте параметры согласно рис. 8.3.6.2.3;
- нажмите на кнопку Сохранить.
В результате будет сформирован виджет Плитка domestic (рис. 8.3.6.2.4).
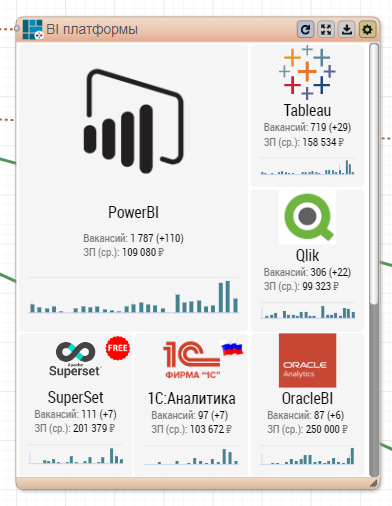
¶ 8.3.6.3. Добавление виджета Плитка BI платформы
Для добавления виджета Плитка BI платформы:
- перейдите на вкладку Виджеты в блоке под областью ведения проекта;
- в папке Основные выберите виджет Плитка и перенесите его в рабочую область на срез biAll.
В настройках виджета:
- переименуйте виджет в “BI платформы”;
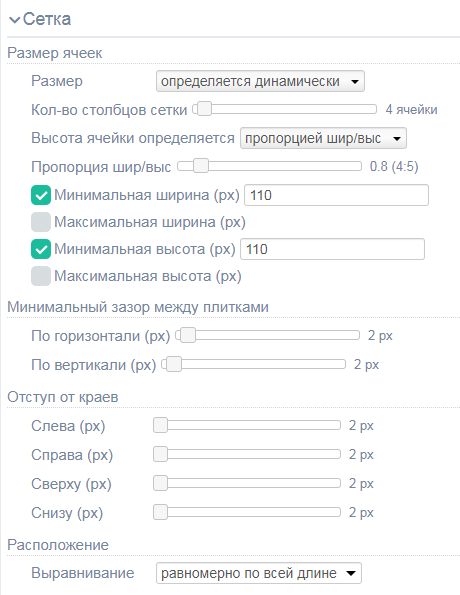
- в блоке Сетка настройте параметры согласно рис. 8.3.6.3.1;
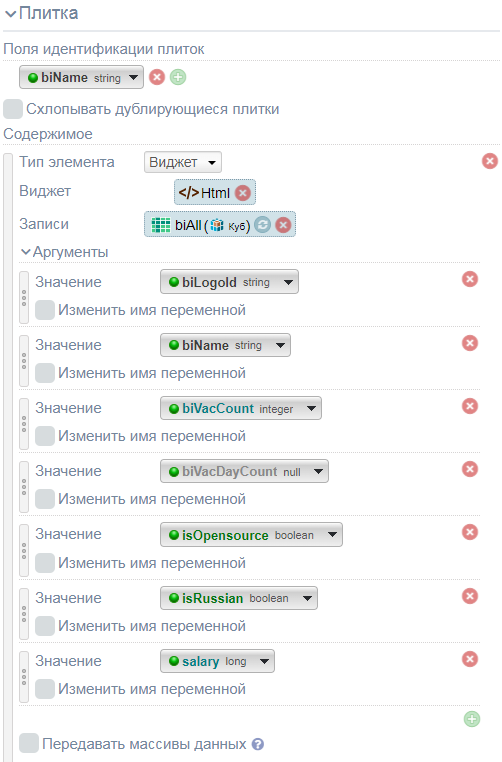
- в блоке Плитка настройте параметры согласно рис. 8.3.6.3.2;
- в поле HTML вставьте код:
{{
function formatNumber(x) {
   return x.toString().replace(/\B(?=(\d{3})+(?!\d))/g, " ");
}
}}
<style>
.biContainer {
 position: relative;
 display:flex;
 flex-direction: column;
 justify-content: space-around;
 align-items: center;
 width: 100%;
 height: 100%;
 font-family: 'roboto_cnregular';
}
.biContainer > .logo {
 display: flex;
 justify-content: center;
 align-items: center;
 position: relative;
 width: 50%;
 height: 50%;
}
 .biContainer > .logo > img.logo {
 max-width: 100%;
 max-height: 100%;
}
 img.flag {
 width: 32px;
 position: absolute;
 right: 2px;
 top: 2px;
}
 img.open {
 width: 26px;
 position: absolute;
 right: 2px;
 top: 2px;
 background-color:#fff;
 border-radius:32px;
}
 .biContainer > .name {
 font-size:16px;
 padding: 1px 0;
 text-align: center;
}
 .biContainer > .items {}
 .biContainer > .items > .opt {
 font-size: 11px;
}
 .biContainer > .items > .opt > .key {
 color: #777;
}
 .biContainer > .items > .opt > .val {}
 .biContainer > .graph {
 height: 60px;
 width: 100%;
}
</style>
{{?it.isRussian}}
<img class="flag" src="/workspace/DownloadEntry.jsb?wsid=fbabde14a8b403a6fe0f58e730a6fb2e&eid=79933a01a084695a012ed2dedbe20131">
{{?}}
{{?it.isOpensource}}
<img class="open" src="/workspace/DownloadEntry.jsb?wsid=fbabde14a8b403a6fe0f58e730a6fb2e&eid=f32811536090dc511b8d15fa0ac827fa">
{{?}}
<div class="biContainer">
<div class="logo">
 <img class="logo" src="/workspace/DownloadEntry.jsb?wsid=fbabde14a8b403a6fe0f58e730a6fb2e&eid={{=it.biLogoId}}">
 </div>
<div class="name">{{=it.biName}}</div>
<div class="items">
 <div class="opt">
  <span class="key">Вакансий: </span>
  <span class="val">{{=formatNumber(it.biVacCount)}}</span>
  {{?it.biVacDayCount}}<span title="новых вакансий за сутки"> (+{{=it.biVacDayCount}})</span>{{?}}
 </div>
 {{?it.salary}}
 <div class="opt">
  <span class="key">ЗП (ср.): </span>
  <span class="val">{{=formatNumber(it.salary)}}</span><span class="key"> ₽</span>
 </div>
 {{?}}
</div>
{{?it.biVacCount > 20}}
<div class="graph" style="height:60px"></div>
{{?}}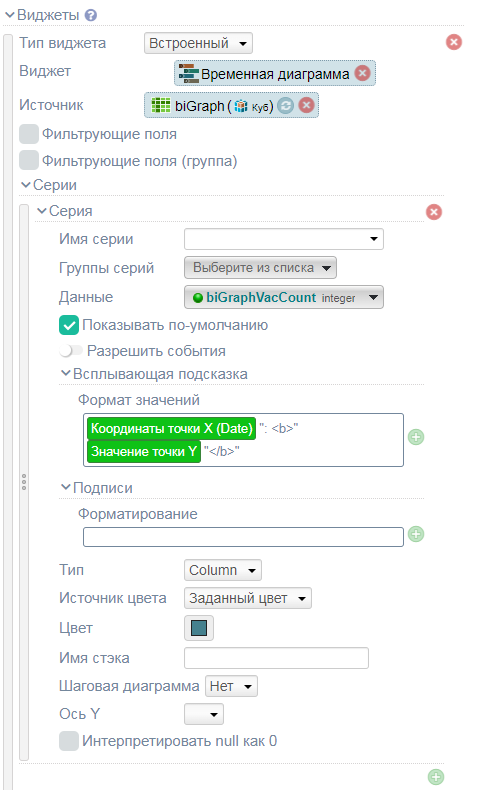
</div>- в поле Виджеты настройте параметры согласно рис. 8.3.6.3.3;
- в поле Внешний вид вставьте:
/* Заполните объект CSS значениями */
{
background-color: #f5f5f5;
border-radius: 4px;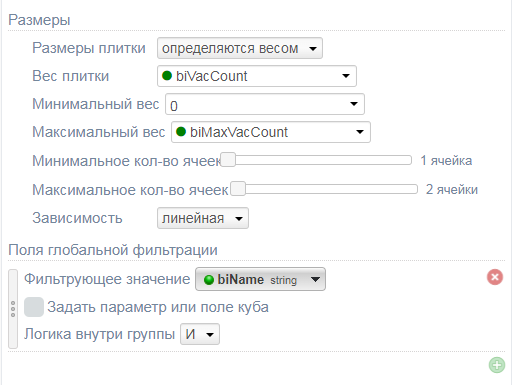
}- в поле Размеры настройте параметры согласно рис. 8.3.6.3.4;
- в блоке Поведение настройте параметры согласно рис. 8.3.6.3.5;
- нажмите на кнопку Сохранить.
В результате будет сформирован виджет Плитка BI платформы (рис. 8.3.6.3.6).